This week was a follow up of the work that was done in the week previous. Professor Joe Hupy required the class to take the data recorded as an Excel file last week and import it into ArcGIS. From there it was required to create surfaces of the terrain which best represent the actual surveyed terrain and the recorded survey data. Several ways to represent the terrain were: inverse distance weighted interpolation (IDW), natural neighbors, kriging, spline, and triangular irregular network (TIN). Then the groups are to convene and see if their sampling scheme was accurate and resurvey areas that may require more data. The same groups were to be kept as the week before.
This was a more technical assignment than the previous week and while it still involved a level of creativity and improvisation, it also required a certain technical aptitude that wasn't required in the previous activity. Through this assignment, the class better learned how to evaluate, visualize, and interpret surveyed data using ArcGIS.
Methods:
The first step in this assignment was to import the xyz data into ArcGIS. After this was accomplished, it was required to make a feature class out of the table in order to run tools and analysis on the data.
 |
| This is the feature class that was first uploaded into ArcMap. There isn't anything very exciting about it seeing as all of the points were measured the same distance apart. However, every one of the points contains a Z value which can be used to represent these points in three dimensions. (Figure 1) |
The next step was to use the different methods available to try to visually represent the surveyed terrain.
IDW:
Inverse distance weighted interpolation determines cell values using a weighted compination of sample points. Essentially this method determines each cell's value by taking the average of a nearby sample of cells. Closer cell values are a stronger determinant than further cell values. A variable search radius can be selected to determine the sampling area.
 |
| (Figure 2a) |
 |
| (Figure 2b) |
These are the 2D and 3D representation of the survey using IDW. The different sampling areas can be seen in the 2D as spots and in the 3D model as points.
Natural Neighbors:
Natural Neighbors interpolation is like IDW but instead of weighting points based on location, it weights points based on finding the closest subset of input samples in the directions of similar values. It uses local values from samples surrounding a query point. It typically doesn't produce pits, peaks, ridges, or valleys that aren't represented by input samples.
 |
| (Figure 3a) |
 |
| (Figure 3b) |
These are the 2D and 3D representations of the survey using natural neighbors interpolation. It can be seen that there aren't any obvious features that weren't included in the actual terrain, like the spikes seen in the IDW method.
Kriging:
Kriging is a method that uses geostatistical methods based on statistical models that include a statistical relationship among the measured points. This helps insure accuracy of the generated surface. Kriging assumes that the distance and/or direction between sample points reflects a spatial correlation can helps explain surface variation. It is best used when it is known there is a spatially correlated distance or direcional bias in the data.
 |
| (Figure 4a) |
 |
| (Figure 4b) |
These are the 2D and 3D representations of the survey using kriging. The image appears very similar to the surveyed terrain. Kriging found a relationship between the evenly spaced points which led to an accurate representation.
Spline:
Spline interpolation uses a function to develop a smooth, curved plane. The function insures that this plane must pass exactly through the datap points and have a minimum curvature. This model does best with surfaces that don't include drastic changes in clumped data.
 |
| (Figure 5a) |
 |
| (Figure 5b) |
These are the 2D and 3D representations of the survey using spline interpolation. The curvature of the model makes it appear quite realistic. However, small mistakes in measurement are noticeable as the curve must go through all measured points.
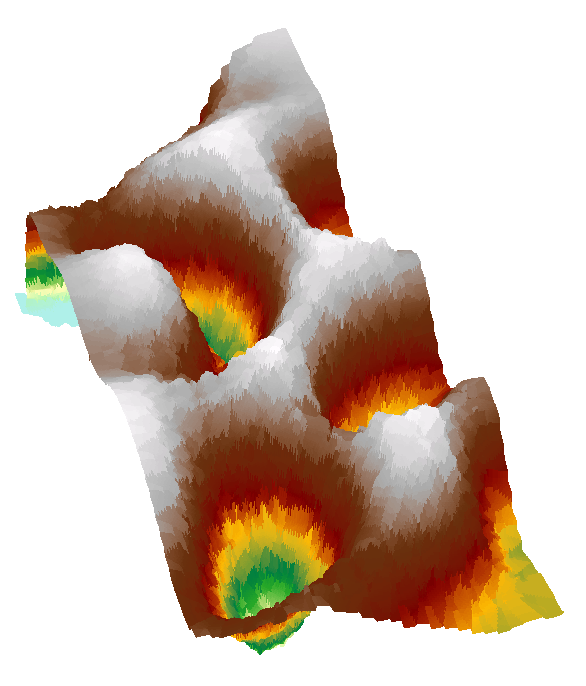
TIN:
A triangular irregular network (TIN) is a digital way to represent surface morphology. They are vector-based and are constructed using a triagular set of vertices. The vertices are connected by edges to for a network of triangles. The nature of TINs tends to represent linear features well, such as ridgelines or stream courses. TINs tend to have a higher resolution in areas of a highly variable surface.
 |
| (Figure 6a) |
 |
| (Figure 6b) |
These are the 2D and 3D representations of the survey using TIN. The ridges that were in the surveyed area are represented well in this model, particularly the 2D model. Though some more variablility could be used in certain areas.
Several of these methods represented the surveyed terrain well in different ways. TIN did a good job showing the ridglines which were a prominent feature in the surveyed terrain, though the lack of point position variablility skewed some areas of the TIN. The kriging 3D model represented the terrain well and doesn't have any drastic skewed results. Also, natural neighbors interpolation represented the surveyed area well seeing as the high points and low points of the terrain were grouped together in a more directionally based way than spatially based, with the ridge following a path.
Discussion:
The various methods learned in this assignment to model a surveyed surface all have their own strengths and weaknesses when it comes to terrain surveying. When a surface is naturally smoother and has no drastic differences in elevation in areas of close proximity, spline interpolation is a good options to choose for modelling the terrain. If the survey points are well varied throughout, particularly at areas of drastic change, kriging or TIN would be good methods to go with. IDW and natural neighbors interpolation both rely on grouped samples of points, while natural neighbors is better for modeling features that are more direction oriented, IDW may be better for evenly spaced, non directional data.
As far as the results for this assignment, IDW didn't give very good results, as the surface appeared spiky and unrealistic (Figure 2b). This is nothing like the original surveyed terrain. Professor Joe Hupy stated that IDW tends to create spikes like this so this appearance isn't a cause of concern when it comes to the data. Natural neighbors interpolation appeared similar to the terrain that was surveyed, though a strange spike that wasn't a part of the data is included (Figure 3b). Kriging created an aesthetically pleasing representation of the surveyed terrain due to the fact that it appears natural. This model is also lacking the strange spike that appeared in the other models (Figure 4b). The kriging method must have eliminated a measurement error that may have been made due to rushing measurements to escape the frigid weather. Spline interpolation created a smooth looking model which appeared to match the surface very well in most places, however, the nature of spline interpolation requires the curve to go through every point recorded (Figure 5b). This leaves room for minor errors to be displayed and not be eliminated by the points around them such as the kriging method. The TIN that was created to model the surveyed surface appeared to match the surface well, particularly the 2D version of the TIN (Figure 6a). However, a better TIN could have been produced had more varied survey points been taken in areas with extremely high variability. Overall, the TIN appeared to be accurate and represent the surface well, but it's clear that it'd be easy to produce a better TIN model by trying a different surveying method.
None of these models showed any drastic difference or error from the actual surface, other than the one spike in the front of every model except the kriging model. The day after the original survey a snow storm hit and skewed all of the data, ruining the grid for the coordinate system as well. This made it too difficult when attempting to repeat the process and gather a second bit of data. It was determined that our models were accurate and fit the surface well. If resurveying had been done after the snow storm, the data wouldn't have been the same and would've looked different from the original survey. This helped reaffirm the need to be flexible and that geographic research, surveying, and the field of geography in general are about and greatly effected by change, as the world is constantly changing.
In the future, a tarp to preserve the surface or anything like that would allow us to resurvey. Being prepared for anything is important and the initial surveying went extremely well, but lacking the proper preparations/equipment (a tarp) prevented additional surveying that could have helped the data appear more realistic and accurate in general.
Conclusion:
The group learned how and when to use all of these methods with the help of eachother and ArcHelp. The group worked well and helped eachother when needed with everyone helping out with the surveying and comparing models to see if any mistakes were made. Though the models represented the surface well, it would've been interesting to go out and try using a different coordinate system for comparison. It would be fascinating to possibly use varied coordinates and measurements in order to see how it would effect the various models such as TIN. One other interesting aspect to think about is how surveying technology, such as remote sensing, would've come into this if it was available to the group. There are near limitless possibilities of how to go about surveying a surface and modeling it. It's up to the survey team to determine the best methods to use.
No comments:
Post a Comment