Sunday, February 23, 2014

Field Activity 4: Distance Azimuth Survey

Introduction:

This week professor Joe Hupy gave the class the assignment of conducting a survey using the distance and azimuth method.  The general idea of this surveying method is to find a base point.  This base point can then be used to map out other features in relation to this base point using the distance and azimuth of each specific feature to the base point.  This method is a low tech method that can be used when more advanced field equipment for mapping points is not working or simply isn't available.  There could be bad weather, it could be too cold for the equipment to work, the equipment might get dropped or break, or the batteries might simply run out.  As Joe said, "technology will fail you", and this method of surveying an area is a way to get around that.  Finding the distance and azimuth of features from a base point can be done in several ways.  The distance between features can be found using a distance measuring tool (Figure 1).  The azimuth from a base point to a specific feature can be found by using a compass (Figure 2).  Also, both the distance and azimuth from a base point to a specific feature can be found using a tool such as the TruPulse Laser (Figure 3).  The TruPulse Laser is also what was used to discover and help record data in this field activity.  All of these tools are made available to geography students at the University of Wisconsin-Eau Claire.

This is a Sonin Electronic Measuring Device and can be used to find the slope distance between one object and another.  How it works is a laser is shot from the left device to the right device and it records the distance.  In distance-azimuth surveying typically one person will go out and stand over the desired feature while another person "shoots" them with the laser and records the distance (Figure 1)
This is a Suunto compass and can be used to find the azimuth of and object from where the user is standing.  The user can look through the whole in the compass while it is pointing at the desired object to be recorded.  In the whole, the user can see the azimuth of the direction the compass is being pointed in relation to the position the user is in.  (Figure 2)
The TruPulse laser is able to find both the slope distance and the azimuth from one position to another.  A user can point it at an object using its magnified zoom and fire a laser at the object.  This laser allows the TruPulse to detect the slope distance from the position of the laser and the azimuth in regards to the position of the laser.  This device was used to record data in this weeks field activity.  (Figure 3)
After a brief demo on how to use the previously mentioned equipment, the class was grouped off and given instructions.  The instructions involved finding an area around Eau Claire and gather a variety of point based data in a plot from a fourth of a hectare to a hectare.  The point based data would have to be found using the distance-azimuth method and around at least 100 different points would need to be gathered with some type of attribute attached to them.  After the data is gathered, it will be required to import the data into ArcMap in order to map out the various surveyed points.

Magnetic declination is one aspect of this problem the class was told to research on its own.  Magnetic declination is the angle between magnetic north and true north as the Earth's magnetic field varies based on location and time.  Using an NOAA declination calculator, it was found the the declination for Eau Claire at the time of the survey would only be about one degree west, this means that recorded data will be one degree less than true north, which is considerable low compared to other areas.


Methods:

Study Area:
The first step in beginning the survey was to determine what area would be studied.  The group decided that Owen Park in Eau Claire would be an excellent location to conduct the survey.  It is a walks distance away from campus and includes many features that can be surveyed such as trees and signs.  In order to be prepared, the group wanted to determine the best place to set the base point beforehand.  Joe Hupy advised the class the using a GPS to calculate the location of a base point would be inaccurate and would take awhile.  He recommended simply finding an easily visible location from a satellite view and using this as the base point.  The latitude and longitude of the base point can be found using ArcMap using this method.  Knowing this and examining a satellite image of Owen Park, it was decided to place the base point on a corner of the tennis court fence (Figure 4).  Points of view from this position can be seen in Figures 5-12.

This is a satellite image of the surveyed area in Owen Park.  The base point for conducting the distance-azimuth survey was set at the corner of the tennis courts and is marked here with an orange dot.  From here this position, the group was able to easily survey the surrounding landscape away from the tennis courts. (Figure 4)

Figure 5
Figure 6


Figure 7
Figure 8


Figure 9
Figure 10


Figure 11
Figure 12


As can clearly be seen in Figures 5-12, when the landscape was surveyed it was considerably more snow-covered and wintry than the satellite image in Figure 4.  This actually helped in the surveying as paths to tree trunks weren't obstructed by leaves and different features further away stood out well against the white snow background.

Surveying:
A TruPulse laser device set on a tripod was used to conduct the surveying (Figure 13, Figure 14).  The group members took turns firing the laser at features and listing the slope distance, azimuth, and feature type (tree, trail sign, house, etc...); while another group member recorded the data that was listed off, recording the object ID #, feature type, slope distance in meters, and azimuth in decimal degrees.  The data was methodically gathered, though luckily it was the warmest day in a month.  An issue that was noticed with using the TruPulse laser was that, at larger distances, the slope distance value wouldn't have decimal places and would therefore lose some accuracy of measurement.  Also, at times objects needed to be re-scanned due to measurements that seemed inaccurate.  This could have been due to the difficulty in holding the TruPulse steady despite the tripod.  After 98 points were gathered and recorded, the batteries on the TruPulse laser died proving Joe Hupy's previous statement that technology will fail.  Thankfully 98 points was enough for this activity, though if the group had been conducting an actual field study and had come unprepared in case the batteries died, nothing could have been done about it.
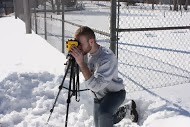
Figure 13
Figure 14

The surveying was performed using a TruPulse laser which was able to find the slope distance of features and the azimuth of features from the set base point.  A tripod was used to help hold the laser steady and minimize error.  Thankfully, the weather was very cooperative on the day of surveying as temperatures reached 45 degrees Fahrenheit, something that hadn't happened for over a month.  This helped make surveying easier and far more enjoyable.

Data Entry and Mapping:
The recorded data was then entered into an Excel spreadsheet (Figure 15) in order to import it into ArcMap.

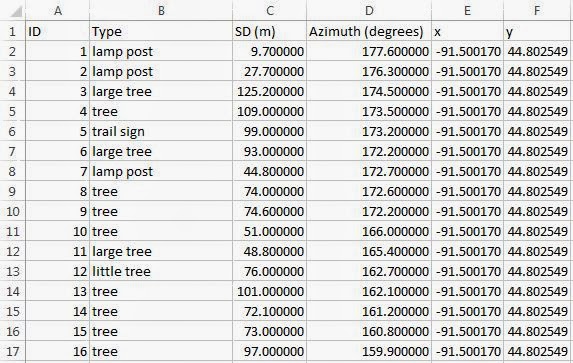
The data that was recorded was entered into the Excel spreadsheet in four columns:  ID, Type, SD (Standard Distance), and Azimuth.  The "x" and "y" columns were added in order to run the "Bearing Distance to Line" tool in ArcMap.  These two columns contain the latitude and longitude of the base point and are all the same as only one base point was used.  The numbers are all extrapolated out to six decimal places and formatted as numbers in order to help more smoothly run tools in ArcMap as this was an issue that other groups had come up with in the past blogs (see FAQ). (Figure 15)

Once ArcMap was open, the first step was to add a base map of Owen Park (Figure 16).  Joe Hupy instructed the class not to use Google aerial images so a Bing aerial image was used.

This is the base map that was brought in thanks to ESRI.  It covers the entire surveyed area and is ready to have data added to it.  (Figure 16)

The next step was to create a geodatabase in order to store data that would be created.  Using folder connections and navigating to the appropriate folders a geodatabase titled dist_az was created specifically for this field activity to store data and help import the Excel spreadsheet.  After this was accomplished, it was required to appropriately calculate the latitude and longitude of the base point in order to properly run all the tools that would be required in the next steps.  To do this a point feature class was created in the dist_az geodatabase.  A point was then placed, by editing, at the appropriate location on the base map (Figure 17).  The point could then be viewed to find that the position of the base point was 44.802549 N and 91.500170 W (Figure 15).

This map shows the position of the base point for the distance-azimuth survey.  It was digitized by creating a feature class and is represented as an orange dot and listed in the Legend as "Laser Site".  Using this point, the group was able to find the latitude and longitude coordinates of the base point.  Knowing this was extremely important as without it, all of the future data would be inaccurate.  (Figure 17) 

Once the base point was set, the next step was to import the Excel spreadsheet.  The spreadsheet was imported into the dist_az geodatabase.  In order to find the locations of the surveyed features, the tool "Bearing Distance to Line" was used.  This tool converted the listed distance and azimuth in the spreadsheet into a line feature class using an X-coordinate field (longitudinal location in decimal degrees of the base point), a Y-coordinate field (latitudinal location in decimal degrees of the base point), a bearing field (azimuth), and a distance field (slope distance) (Figure 18).

This map shows the base point and the resulting lines from the "Bearing Distance to Line" tool.  These lines are more or less the lines of site that the TruPulse laser used to gather the data that was required.  (Figure 18)


However, these lines did not give the position of the surveyed features.  The position of the surveyed features was actually at the end vertex of each line.  There is a simple tool in ArcToolbox called "Feature Vertices to Points".  This tool can take a line feature class and simply put points on the vertices as a new feature class.  This is exactly what was needed in order to map out the surveyed features (Figure 19).


This map shows the locations of the surveyed features under the Legend as "Survey Points".  These points were located using the "Feature Vertices to Points" tool, and it can be seen that the mapped points are all on the vertices of one of the lines.  (Figure 19)

The points on the map were fine, but they didn't properly represent the features that had been surveyed.  These were just points, the data that had been surveyed contained feature type.  In order to create a map with the feature type, a join was performed in ArcMap.  This joined the "Surveyed Points" features with the original spreadsheet that was brought in.  The join was based on the "Original ID" field and the "ID" field in the spreadsheet.  This allowed a map more properly representing the different features to be created (Figure 20).

This is a final map of the surveyed features in the designated survey area in Owen Park.  The base point is still represented by "Laser Site" in the legend, while all other points are symbolized by the type of feature they were deemed to be.  The features that were unique in their feature type were grouped under "all other values", these include:  bridge support, large white pole, portable toiled, garbage can, apartment sign, and bus stop.  This map does show that there are some problems with the surveying that was performed, as it is unlikely a large tree was off shore in the Chippewa River.  (Figure 20)


Results/Discussion:

The problem with the location of the two features off of the Chippewa River bank (Figure 20) is an issue that should be addressed.  It is likely that this issue occurred due to the features being so far away.  While the TruPulse laser does feature a magnifying glass to better aim and shoot features further away, it seems that the further away a feature is, the more inaccurate of a reading the device gives.  This could be due to user error, as it is hard to aim at such far objects and hold the laser steady, even with a tripod.  It could also be in part due to the previously mentioned fact that at greater distances the TruPulse laser doesn't give the slope distance measurement out to the accuracy of decimal points, it only returns whole numbers.  Knowing this, it may be best to only use the TruPulse to perform distance-azimuth surveying on close to medium objects, or at least objects under 100 meters away.  A way to avoid this in the future would be to set up multiple base points far enough away from each other to insure that the objects that are too far away from one base point to get an actual reading are well within the limits of the other base point.

Other than the few points that were far away from the base point, most of the points appear to be accurate.  The tree features are clumped in areas where it appears there are trees, and there are no random tree features in random empty areas that are very apparent.  There were many features that were not surveyed due to there being an abundance of available features, a limited time, a limited requirement, and the batteries on the TruPulse dying.

In many ways the group was well prepared for this activity.  Everyone was able to study up on what had occurred in previous attempts at this activity from old blogs.  The equipment that was required (TruPulse, tripod, and camera) was all rented and brought to the survey site.  A good base point in a high, open area with a good vantage point that was able to be seen from a satellite view was selected which enabled the mapping out of this point and the actual surveying with the laser to go smoothly.  Though the team failed to bring spare batteries or back up surveying devices such as a compass (Figure 2) or a distance finder (Figure 1), enough features were already surveyed and recorded by the time the TruPulse died.  The beautiful weather while surveying also helped keep spirits up and made the whole process enjoyable, as can be seen, not even gloves were needed (Figure 13).

The use of this data in ArcMap was rather limited as all that was recorded was feature type, and there isn't much that can be done in terms of analysis of feature type, especially considering most of the features were trees.  However, bringing the data into ArcMap and creating a map of the features based on feature type (Figure 20) helps show that the survey was accurate for the most part as there are no random tree features in the residential area in locations close to medium distance away from the base point.  However, there are a few mistakes as the data gets further away as mentioned before (house in a forested area and tree off shore).


Conclusion:

This method of surveying doesn't require a large amount of technology.  All that's needed to perform a distance-azimuth survey at it's most basic level is a compass and some sort of measuring device, as long as the location of the base point is established.  This activity took it one level higher and used a laser device to perform the survey.  The activity taught the class how to properly perform the survey and be prepared for set-backs such as technology failing to occur when doing field work.  In the future it'd be interesting to go out and use just the compass and a survey tape measure, instead of the TruPulse laser, to see how accurate of results can be obtained using a distance-azimuth survey.

Sunday, February 16, 2014

Field Activity 3: UAV Systems Research and Advising

Introduction:

This week's activity is less of a "field activity" and more of a research project.  The class was given five scenarios (which will be laid out later in this report) and required to find a solution to each scenario using and involving UAV systems.  These problems are inherently ambiguous as the class was required to ask questions and use critical thinking to find solutions.  This activity requires knowledge that goes above and beyond that which is typically required for classwork so coming up with solutions required intricate research into each situation and into the various UAV systems themselves.

UAV Overview:

An Unmanned Aerial Vehicle (UAV) or Unmanned Aerial System (UAS) is an aircraft that has the capability of autonomous flight, without a pilot in control. Amateur UAVs are non-military and non-commercial. They typically fly under “recreational” exceptions to FAA regulations on UAVs, so long as the pilots/programmers keep them within tight limits on altitude and distance. Usually the UAV is controlled manually by Radio Control (RC) at take-off and landing, and switched into GPS-guided autonomous mode only at a safe altitude. UAVs can typically be piloted using an autopilot. This software can either come with the UAV when purchased or can be purchased seperatedly. An example of this software is APM 2.6 autopilot which retails for around $200. Mission planning software is also an essential function of successful use of a UAS. This is a software that allows a ground station to keep constant surveillance of a UAS while it is in flight. Depending on the software, full flight missions can be pre-programmed into the UAS using the mission planner. Data can be analyzed in real time using a graphical interface, and the UAS may be piloted using the ground station in place of the typical remote control. Two examples of this software that are popular in today's market are APM:Plane for fixed-wing aircraft and APM:Copter for rotary-wing aircraft. This software may come with the UAV when purchased.  

Three common types of UAVs include fixed-wing aircraft, helicopters, and multi-arm copters (multicopters).

Fixed-Wing Aircraft:
When it comes to UASs, fixed wing aircraft are essentially small, unmanned planes. They are capable of long flight times depending whether they are gas powered (typically 10 hours) or electric powered (typically up to an hour). Fixed-wing UAVs are more forgiving than rotary craft in the event of mechanical failure and/or pilot error due to their natural ability to glide without power and can carry larger payloads than a typical rotary craft for longer distances on less power. However, a fixed-wing UAV cannot hover in one spot as rotary craft can, and due to this they cannot provide the same level of precision imagery as rotary craft. Fixed-wing craft also require a runway to take off from as they are not equipped to perform vertical takeoff. This type of UAS can vary greatly in price depending on flight time and payload capacity.


This is an example of a typical fixed-wing UAV.  This particular model has a payload capacity of 8kg and a flight time of 3 hours.  This image is courtesy of  the Center of Advanced Aerospace Technologies.  (Figure 1)

Helicopters:
     Helicopter UAVs are single rotary aircraft which means they contain a single lifting motor with two or more blades.  They come in both gas and electric and are capable of medium manage flight, though their range in heavily dependent on payload.  A typical electric helicopter can fly anywhere between 20-90 minutes, while a typical gas powered helicopter UAV may be able to fly between 4-5 hours for more expensive models.  Unlike a fixed-wing aircraft, helicopters are capable of vertical takeoff and the ability to hover to take detailed imagery.  The ability to hover also helps with the users ability to analyze real-time feedback.  Helicopters are extremely versatile due to being able to carry heavy payloads, fast, and have long flight times.
This is an example of a helicopter UAV.  This model has a payload capacity of between 5-7 kg, has 30 minutes of flight time for the electrical version and 1.5 hours for the gas powered version.  It comes installed with HD and infrared cameras.  This image is courtesy of the Center of Advanced Aerospace Technologies.  (Figure 2)

Multicopters:
     Multicopter UAVs are similar to helicopter UAVs, however they utilize over three separate lifting motors.  There is a large variety of multicopters ranging from systems with three lifting motors to systems with eight lifting motors or above.  This wide variety of model types allows for a large degree of flexibility in mounting a payload on the craft.  The large amount of lift sources provides more safety than the large blades of helicopter UAVs These systems can be extremely stable in strong wind conditions, however they require on-board computer systems to be flying.  Like helicopters, multicopters are excellent for hovering and taking detailed imagery of an area.  Multicopters have considerably shorter battery life than their fixed-wing or single-wing counterparts as they can only typically fly 20-30 minutes maximum.  Also, more arms typically means shorter flight time as the separate motors suck up more power.  The most popular model is the quadcopter; it has four arms and is seen as the least complicated, most user-friendly of multicopter models.

This is an example of a multicopter.  This particular model is a quadcopter and is one of the simpler multicopter designs.  This image is courtesy of AeroQuad.  (Figure 3)

Methods:

In this section of the report, the scenarios the class was given and the designed solutions and suggestions will be laid out and explained one by one.

Scenario One:
     A pineapple plantation has about 8,000 acres and they want to have an idea of where they have vegetation that is not healthy, as well as have an idea about when it might be a good time to harvest.

Pineapple plantations typically are placed in tropical climates where the pineapple plant thrives.  They are vast, flat expanses of land with low lying vegetation.  This particular image is of a pineapple plantation in Ghana.  (Figure 4)

The first step in solving this problem is determining how to tell if the vegetation is healthy or not. This can be done by looking at the reflectance of energy off of the various areas of the pineapple plantation. A typical way of looking at vegetation is using near-infrared energy (NIR). NIR has longer wavelengths than visible light and has some properties that allow it to be used for remote sensing applications.

Vegetation is a strong reflector of NIR, that is saying that when NIR hits the plant, it is mostly not absorbed. Half of it is transmitted through the vegetion, while the other half is reflected back off of the plant. This is caused by NIR hitting the plant and interacting with mesophyll cells. Plants with healthy mesophyll cell walls will reflect more NIR, while plants with unhealthy mesophyll cell walls will allow NIR to be transmitted through them (Figure 5).
This image shows the reflectance/absorption/transmittance of energy of a typical healthy leaf.  The visible red and blue light are absorbed by the leaf while the green visible light is reflected.  This gives vegetation its typical green appearance.  The IR is being mostly reflected in this image as this is a representation of a healthy leaf with healthy mesophyll cell walls.  (Figure 5)
The transmittance of NIR in unhealthy vegetation causes healthy vegetation to appear bright on an NIR camera, while unhealthy vegetation will appear dimmer. By monitoring the amount of NIR and visible energy reflected from vegetation is is possible to determine whether or not the vegetation is healthy (Figure 6).


The reflectance of NIR in healthy vegetation is much greater in healthy vegetation than in unhealthy vegetation.  This causes healthy vegetation to appear much brighter through an NIR camera than unhealthy vegetation.  (Figure 6)
The same concept of monitoring reflectance can be applied to determining whether or not the pineapples are ready to be harvested.  Pineapples that are ready to harvest need to be at least 1/3 yellow (Figure 8).  If the pineapple is still green throughout, it is not ready to be harvested (Figure 7).

This pineapple is ready to be harvested. (Figure 8)
This pineapple is not ready to be harvested yet. (Figure 7)


When analyzing a graph of visible light reflectance, which a camera would be able to capture, one would just have to look for areas of higher yellow light reflection in order to determine whether a particular area is ready to harvest or not.

In order to accomplish these tasks and obtain this imagery, a UAS can be used. When considering which type of UAS to use, it is important to consider the scenario. The pineapple plantation is made up of 8,000 acres which would be too large for a multicopter's short range to cover. Precision imagery is also needed of the various areas of the plantation, also there is likely no area for a fixed-wing aircraft to take off that would be nearby the plantation. This rules out fixed-wing UAVs. A helicopter with an infrared camera mounted on it would be a good option to capture the needed imagery. The gas engine would provide enough flight time to cover the entire plantation, while the maneuverability of the helicopter would do well in analyzing specific areas in real time.

A good option for this job is the Sniper Heli, it can be fitted with a wide variety of payloads up to 4kg including IR sensors, and if fully autonomous, which cuts down on needing to train a pilot. With the right mission planner installed in the craft it can go out and take images of the field without anyone even having to pick up a controller.


Scenario Two:
A power line company spends lots of money on a helicopter company monitoring and fixing problems on their line (Figure 9). One of the biggest costs is the helicopter having to fly up to the towers to see if there is a problem. Another issue is the cost of figuring how to get to the lines from the nearest airport.
Monitoring power lines using large helicopters and worker hanging out of them is an expensive and dangerous option which can be made unnecessary through the use of UAV systems.  (Figure 9)
A solution to this problem involves getting a UAV close to the power lines in order to take very high quality imagery. This immediately rules out using a fixed-wing UAS as it would not be capable of staying in one area to take the imagery. A multicopter would be a good option to perform the monitoring. Things to take into account in this situation are the location of the power lines. If the power lines are near a residential or area with a lot of wildlife or cattle, the multicopter should be required to operate at a low noise level so as to not disturb any animals or people.

The Aibot X6 was specifically designed with the idea of inspecting high voltage power lines. It has a 3kg payload capacity, is able to take high resolution digital images, thermal imagery to detect hot spots, and has excellent flight stability to insure safety around the power lines (Figure 10). This particular model also comes loaded with some of the most sophisticated mission planning software in order to insure a smooth flight each and every time.
The cage around the Aibot X6 helps prevent collisions with power lines.  It is one of the industry standards in power line inspection and would be invaluable when replacing the standard large helicopter inspection methods.  (Figure 10)
The cost of the Aibot X6 is rather steep at about $30,000 per multicopter, but the copter will pay off in the long run when considering how much the company is likely paying for a helicopter rental every time it has to go out and inspect the line. It's a pricey start up, but the reliability and safety of this model will go a long way to making the investment worth it.

One downside of using this multicopter is that the range is limited to 20 minutes of flight time. This can be problematic when considering that not all of the power lines will be easily accessible to a ground crew to get close enough with the Aibot. Due to this, it may be a good idea for the company to purchase a UAV helicopter as well. The Black Eagle (Figure 11) designed by Steady Copter is a solid option to supplement the Aibot X6 or replace it all together if the company decides. It may be less safe than the Aibot but it provides many of the same benefits while still being able to hover within 5 meters of a power line and having a much longer flight time of 3 hours. It is also cheaper,starting at only $10,000. The location of the particular power line or how the power lines are laid out would really determine which option the company would choose to go with or if they'd want to use both the Aibox X6 and Black Eagle to supplement each other based on their strengths.


The Black Eagle is a solid supplement or replacement to the Aibot X6 depending on the situation which may arise.  The Black Eagle would thrive when longer distances need to be covered to get to a power line more rapidly but is a slight downgrade in safety and software it is equipped with.  (Figure 11)


Scenario Three:
A military testing range is having problems engaging in conducting its training exercises due to the presence of desert tortoises. They currently spend millions of dollars doing ground based surveys to find their burrows. They want to know if there is a better possible solution using UAS.


The desert tortoise is listed as "threatened" under the Endangered Species Act.  They are able to live as long as 60 to 80 years and can survive up to a year without access to water.  (Figure 12)
The desert tortoise (Figure 12) is a medium-sized tortoise which inhabits the deserts of the western USA. Desert tortoises live in some of the most extreme habitats in North America. The tortoises have been showed to be spread about in the Mojave and Sonoran deserts in a density of anywhere between 5 and 60 adults per square mile. Desert tortoises spend 95% of their lives in their burrows. This makes solving this problem not a matter of finding tortoises, but, mainly, of finding burrows. Desert tortoise burrow construction requires soil that can crumble while the tortoise is digging but will hold enough to resist collapse. Typically the proper soil is a sandy loam with varying amounts of gravel and clay. Tortoises really try to avoid sand as it will collapse too easily. Also, 97% of burrow locations have been found to be associated with shrub vegetation. The depth to a limiting layer is also very important in determining where desert tortoises may avoid placing burrows.

The area occupied by desert tortoises is vast and would require a fixed wing aircraft to go out and analyze quickly. The UAV would likely have to be gas powered in order to help it analyze as much areas as possible. The particular analysis it would be performing is using a multi-spectral scanner to search for shrub type vegetation using UAV and to determine soil type and depth using using visible-near infrared scanners. Tortoises have also been shown to live in areas where there are higher amounts of nutrients in the soil due to the fact that they have been shown to eat small rocks to gain minerals. Analysis of the soil using near infrared would make it possible to determine nutrient concentration in the soils. One other way to determine the location of burrows would be to use the thermal band of the wavelength spectrum (Figure 13) to find changes in ground temperature which may correspond to tortoise burrows. This type of analysis should be performed at dusk when the ground is starting to cool.  
This is the wavelength spectrum.  In order to determine locations of tortoise burrows a multispectral approach should be used.  This approach would involve using NIR reflection to determine shrub location and soil nutrient content and using thermal reflection to find ground temperature differences which may correspond to burrow locations.  (Figure 13)

By analyzing the data collected by the UAV, it will be possible to determine areas favorable to desert tortoise burrows and areas where there are actually burrows. The training could then be set to take place in areas which avoid the burrow habitat or are in areas which have been deemed uninhabitable for the tortoises (sandy areas, areas with no vegetation, or areas where there aren't a proper amount of soil nutrients). Areas where it's likely that there could be tortoises or where tortoise burrows were found would need to be further analyzed using more sweeps with the UAV or by the ground team.


Scenario Four:
An oil pipeline running through the Niger River Delta is showing some signs of leaking. This is impacting both agriculture and loss of revenue to the company.

The Niger River Delta (Figure 14) is typically seen as one of the most polluted areas in the world. Between 1976 and 2001 there were almost 7,000 incidents involving oil spills. On average, around 240,000 barrels of oil a year are spilled into the Niger.
The Niger River delta is one of the most polluted places in the world.  This is in major part due to the large oil reserves in the area and the lack of care taken to extract and transport them.  The pipelines frequently leak causing environmental damage and causing the agriculture in the area to suffer.  (Figure 14)
This area is also one of the more dangerous locations in the world. This could make getting near to the pipeline to use low range UAVs difficult. The length of the pipeline may also warrant using a long range UAV. These facts point to a fixed-wing craft being the best option.

Thermal imagery is one way that can be used to try to find areas where there are leaks in the pipeline. A fixed-wing UAV would be released with a thermal imagery and visible spectrum camera on it. This should take place just after sunset when the temperature drops, this allows for better interpretation of thermal imagery. There should be a change in heat capacity of the ground in areas with oil on them and areas without oil (Figure 15). It is important to have both thermal and visual imaging to provide for better analysis. Another aspect to take into consideration is using a UAV with a motor that won't give off too much heat as this could skew the quality of the thermal image.
As can be seen in this thermal image of an oil pipeline, depending on the size of the oil leak, thermal imagery can do a good job in detecting oil leaks efficiently.  (Figure 15)
These scans would need to be done over time to get a good idea of where the oil leaks are and see the various changes in the locations of new leaks. Also, in order to determine whether there is subsurface leaking a 3D computer based thermal model of the buried pipeline and its surrounding soil could be created. This would take into account the various materials in the vicinity of the pipeline.

The Talon 240 is an electrical powered UAV with a battery life of up to 6 hours and a range of up to 20 miles. It can handle large payloads and the electric engine will cut down on the heat that would be generated if it were a gas engine. The Talon 240 is also quiet and can fly at a high altitude. This will help avoid the Talon getting in trouble from ground sources who might want to take shots at something flying above, seeing as this area in the Niger River Delta is very dangerous.


Scenario Five:
A mining company wants to get a better idea of the volume they remove each week. They don't have the money for LiDAR, but want to engage in 3D analysis.

The solution to this problem depends on several factors. How expansive is the mining operation and is it an open pit mine? Judging by the fact that the company doesn't have the money for LiDAR, this report will go forward assuming this is a medium to small scale open pit mine (Figure 16).

This is an aerial image of an open pit mine.  This is the type of imagery that would be initially needed in order to perform 3D analysis without LiDAR.  (Figure 16)
The first step would be to gather the proper aerial imagery. This imagery needs to be shot in sequence with a large amount of overlap between the images in order to create a good 3D image. The gathering of this data can be done using a multicopter or helicopter UAV. The multicopter or helicopter doesn't need to be of the highest quality it just needs to be able to capture the images every week to check the progress of volume removed. The relatively inexpensive 3DR Arducopter would be able to easily take images such as Figure 12. If price ends up being a huge issue, it is also possible to gather this type of imagery using balloons.

The next step in the process is to upload the image files to Photosynth.  This website will create a 3D image with point cloud data.  This data can then be extracted using a program such as SynthExport.  The data will now be in x,y,z form and can be brought into ArcGIS or a free product like MeshLab to create a 3D surface or mesh.  If in ArcMap use the "Surface Volume" tool which will give the area and volume of a raster or TIN surface above or below a given reference plane.  By setting the reference plane at a control depth, the change in volume can be analyzed each week to determine the amount mined by the company.

Discussion:

UAV systems have large variation and can provide many different solution to many different problems.  In the first scenario, a large pineapple plantation wanted to know how to tell if its crops were healthy.  This project required the use of a helicopter UAV using NIR imagery to display vegetation health.  The second scenario simply required a cheaper, safer option in order to monitor power line issues, this can be solved rather easily using a rotary-arm UAV with a high-definition camera.  Scenario three warranted use of a fixed-wing craft to determine soil type and nutrient concentration in order to find tortoise burrows.  The fourth scenario required a long range UAV fixed-wing craft using thermal imagery to find locations of oil leaks on a pipeline.  Scenario five then was a problem which concerned 3D analysis without LiDAR.  This scenario involved taking a large amount of simple imagery either from a rotary-wing UAV or a balloon and converting it to a usable 3D form using various internet programs.

All of these scenarios required more than just a level of understanding of each individual scenario, the UAV systems, and remote sensing imagery and analysis.  These scenarios required the ability to take every aspect of the situation into account and to put them all together.  They required the use of geographical knowledge of many different fields.  This is what is great about geography, it is so interdisciplinary and encompasses so much.  Geographic thinking and skills can be used to find leaks in pipelines in Niger or protect turtles in the Southwest United States and everything in between.

Conclusion:

This research activity encompassed many different fields and required a large amount of research to complete.  Advising the various companies in the wide variety of tasks wasn't easy.  Each scenario required a different approach, using different UAV systems, and different technologies in general.  This activity was an excellent way to get the class thinking about how they can best apply their learnt knowledge to real world activities and problems.

Sunday, February 9, 2014

Field Activity 2: Visualizing and Refining a Terrain Survey

Introduction:

This week was a follow up of the work that was done in the week previous.  Professor Joe Hupy required the class to take the data recorded as an Excel file last week and import it into ArcGIS.  From there it was required to create surfaces of the terrain which best represent the actual surveyed terrain and the recorded survey data.  Several ways to represent the terrain were:  inverse distance weighted interpolation (IDW), natural neighbors, kriging, spline, and triangular irregular network (TIN).  Then the groups are to convene and see if their sampling scheme was accurate and resurvey areas that may require more data.  The same groups were to be kept as the week before.

This was a more technical assignment than the previous week and while it still involved a level of creativity and improvisation, it also required a certain technical aptitude that wasn't required in the previous activity.  Through this assignment, the class better learned how to evaluate, visualize, and interpret surveyed data using ArcGIS.

Methods:

The first step in this assignment was to import the xyz data into ArcGIS.  After this was accomplished, it was required to make a feature class out of the table in order to run tools and analysis on the data.
This is the feature class that was first uploaded into ArcMap.  There isn't anything very exciting about it
seeing as all of the points were measured the same distance apart.  However, every one of the points contains
a Z value which can be used to represent these points in three dimensions. (Figure 1)


The next step was to use the different methods available to try to visually represent the surveyed terrain.

 IDW:
     Inverse distance weighted interpolation determines cell values using a weighted compination of sample points.  Essentially this method determines each cell's value by taking the average of a nearby sample of cells.  Closer cell values are a stronger determinant than further cell values.  A variable search radius can be selected to determine the sampling area.

(Figure 2a)
(Figure 2b) 
These are the 2D and 3D representation of the survey using IDW.  The different sampling areas can be seen in the 2D as spots and in the 3D model as points.


Natural Neighbors:
     Natural Neighbors interpolation is like IDW but instead of weighting points based on location, it weights points based on finding the closest subset of input samples in the directions of similar values.  It uses local values from samples surrounding a query point.  It typically doesn't produce pits, peaks, ridges, or valleys that aren't represented by input samples.


(Figure 3a)
(Figure 3b)
These are the 2D and 3D representations of the survey using natural neighbors interpolation.  It can be seen that there aren't any obvious features that weren't included in the actual terrain, like the spikes seen in the IDW method.


Kriging:
     Kriging is a method that uses geostatistical methods based on statistical models that include a statistical relationship among the measured points.  This helps insure accuracy of the generated surface.  Kriging assumes that the distance and/or direction between sample points reflects a spatial correlation can helps explain surface variation.  It is best used when it is known there is a spatially correlated distance or direcional bias in the data.

(Figure 4a)
(Figure 4b)
These are the 2D and 3D representations of the survey using kriging.  The image appears very similar to the surveyed terrain.  Kriging found a relationship between the evenly spaced points which led to an accurate representation.


Spline:
     Spline interpolation uses a function to develop a smooth, curved plane.  The function insures that this plane must pass exactly through the datap points and have a minimum curvature.  This model does best with surfaces that don't include drastic changes in clumped data.

(Figure 5a)
(Figure 5b)
These are the 2D and 3D representations of the survey using spline interpolation. The curvature of the model makes it appear quite realistic.  However, small mistakes in measurement are noticeable as the curve must go through all measured points.  


TIN:
     A triangular irregular network (TIN) is a digital way to represent surface morphology.  They are vector-based and are constructed using a triagular set of vertices.  The vertices are connected by edges to for a network of triangles.  The nature of TINs tends to represent linear features well, such as ridgelines or stream courses.  TINs tend to have a higher resolution in areas of a highly variable surface.

(Figure 6a)
(Figure 6b)
These are the 2D and 3D representations of the survey using TIN.  The ridges that were in the surveyed area are represented well in this model, particularly the 2D model.  Though some more variablility could be used in certain areas.


Several of these methods represented the surveyed terrain well in different ways.  TIN did a good job showing the ridglines which were a prominent feature in the surveyed terrain, though the lack of point position variablility skewed some areas of the TIN.  The kriging 3D model represented the terrain well and doesn't have any drastic skewed results.  Also, natural neighbors interpolation represented the surveyed area well seeing as the high points and low points of the terrain were grouped together in a more directionally based way than spatially based, with the ridge following a path.

Discussion:

The various methods learned in this assignment to model a surveyed surface all have their own strengths and weaknesses when it comes to terrain surveying.  When a surface is naturally smoother and has no drastic differences in elevation in areas of close proximity, spline interpolation is a good options to choose for modelling the terrain.  If the survey points are well varied throughout, particularly at areas of drastic change, kriging or TIN would be good methods to go with.  IDW and natural neighbors interpolation both rely on grouped samples of points, while natural neighbors is better for modeling features that are more direction oriented, IDW may be better for evenly spaced, non directional data.

As far as the results for this assignment, IDW didn't give very good results, as the surface appeared spiky and unrealistic (Figure 2b).  This is nothing like the original surveyed terrain.  Professor Joe Hupy stated that IDW tends to create spikes like this so this appearance isn't a cause of concern when it comes to the data.  Natural neighbors interpolation appeared similar to the terrain that was surveyed, though a strange spike that wasn't a part of the data is included (Figure 3b).  Kriging created an aesthetically pleasing representation of the surveyed terrain due to the fact that it appears natural.  This model is also lacking the strange spike that appeared in the other models (Figure 4b).  The kriging method must have eliminated a measurement error that may have been made due to rushing measurements to escape the frigid weather.  Spline interpolation created a smooth looking model which appeared to match the surface very well in most places, however, the nature of spline interpolation requires the curve to go through every point recorded (Figure 5b).  This leaves room for minor errors to be displayed and not be eliminated by the points around them such as the kriging method.  The TIN that was created to model the surveyed surface appeared to match the surface well, particularly the 2D version of the TIN (Figure 6a).  However, a better TIN could have been produced had more varied survey points been taken in areas with extremely high variability.  Overall, the TIN appeared to be accurate and represent the surface well, but it's clear that it'd be easy to produce a better TIN model by trying a different surveying method.

None of these models showed any drastic difference or error from the actual surface, other than the one spike in the front of every model except the kriging model.  The day after the original survey a snow storm hit and skewed all of the data, ruining the grid for the coordinate system as well.  This made it too difficult when attempting to repeat the process and gather a second bit of data.  It was determined that our models were accurate and fit the surface well.  If resurveying had been done after the snow storm, the data wouldn't have been the same and would've looked different from the original survey.  This helped reaffirm the need to be flexible and that geographic research, surveying, and the field of geography in general are about and greatly effected by change, as the world is constantly changing.

In the future, a tarp to preserve the surface or anything like that would allow us to resurvey.  Being prepared for anything is important and the initial surveying went extremely well, but lacking the proper preparations/equipment (a tarp) prevented additional surveying that could have helped the data appear more realistic and accurate in general.

Conclusion:

The group learned how and when to use all of these methods with the help of eachother and ArcHelp.  The group worked well and helped eachother when needed with everyone helping out with the surveying and comparing models to see if any mistakes were made.  Though the models represented the surface well, it would've been interesting to go out and try using a different coordinate system for comparison.  It would be fascinating to possibly use varied coordinates and measurements in order to see how it would effect the various models such as TIN.  One other interesting aspect to think about is how surveying technology, such as remote sensing, would've come into this if it was available to the group.  There are near limitless possibilities of how to go about surveying a surface and modeling it.  It's up to the survey team to determine the best methods to use.